International Journal of Remote Sensing School of Computer Science and Engineering, Shandong University of Science and Technology
Among crop nutrients, nitrogen has the greatest influence on growth and yield, and the application rate is also the largest. By studying the spectral characteristics of crop total nitrogen content, a hyperspectral estimation model of crop nitrogen content is established to quickly diagnose the nitrogen status of crops. Guiding effective fertilization has practical significance. Compared with traditional multi-spectral remote sensing, high-resolution resolution remote sensing technology has many bands, high spectral resolution and continuous characteristics. It can directly perform quantitative analysis of weak spectral differences on ground objects, and it is powerful in vegetation remote sensing research and application. Advantage. The UAV-based hyperspectral image acquisition method has the advantages of flexibility and real-time, and can quickly acquire hyperspectral image data of large-area crops. The S185 airborne high-speed imaging spectrometer uses frame-type imaging technology to capture hyperspectral image data of large-area crops quickly, accurately and in real time, which plays an important role in crop growth monitoring, yield estimation and pest control.
1 sample selection
The research site is Beijing National Precision Agriculture Base. The sample area of ​​winter wheat is about 150m2. The whole sample field is divided into 48 plots, which are planted with different water, fertilization and variety of wheat. The specific distribution is shown in the following figure:
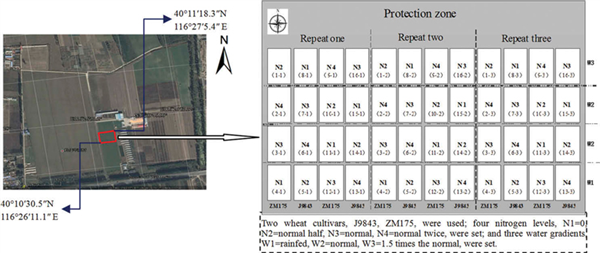
Figure 1 Sample field distribution map - National Precision Agriculture Demonstration Base
2 hyperspectral data acquisition
The hyperspectral image data was acquired by the German Cubert S185 airborne high-speed imaging spectrometer with a spectral range of 450-950 nm, a spectral sampling interval of 4 nm, a flying height of 50 m, and a ground spatial resolution of approximately 0.02 m. The flight tests were carried out on April 15, 2015, April 26, 2015, May 12, 2015 and May 27, 2015. The above dates correspond to the jointing, flagging, and flowering periods of winter wheat, respectively. During the filling period, the hyperspectral data corresponding to different growth periods are as follows:
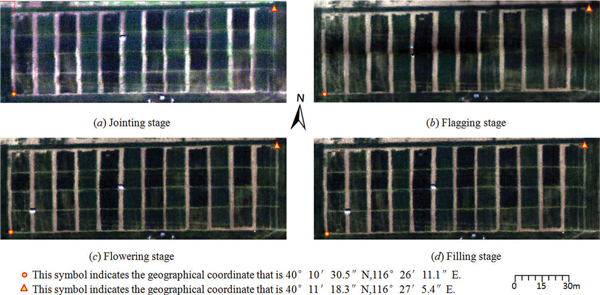
Fig.2 RGB composite map of S185 hyperspectral data of four growth stages of winter wheat in the field
The correlation between the different bands of the four growing seasons and the nitrogen content of the leaves is shown in the following figure:
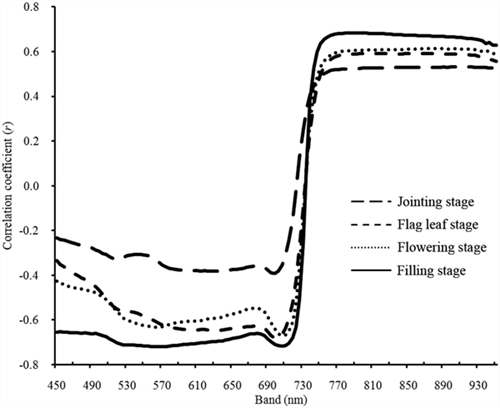
Fig.3 Correlation between different bands and leaf nitrogen content in four growth stages of winter wheat in the field
3 model analysis
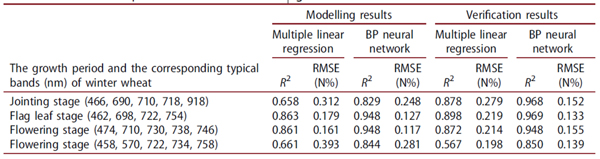
Selection table for typical bands of models (based on multiple linear regression and BP neural network model correlation and root mean square error):
The characteristic bands corresponding to the four growth periods, such as jointing stage, flag-picking period, flowering stage and filling stage, are shown in the following figure:
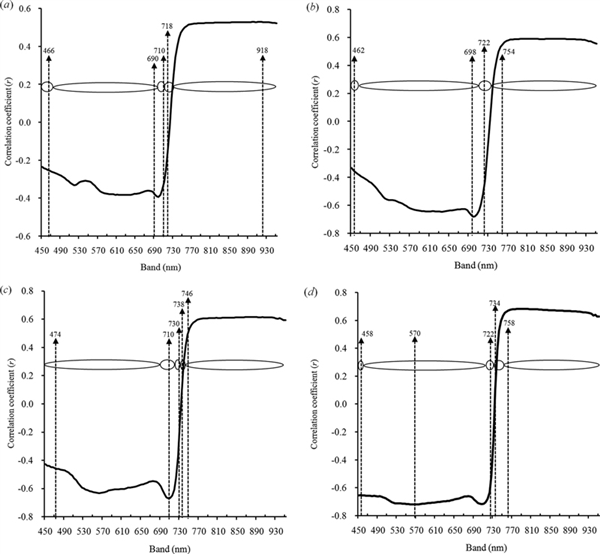
Figure 4: Characteristic bands of four growth periods: (a): jointing stage (b): picking stage (c): flowering stage (d): filling stage
4 model verification
The model verification results based on multiple linear regression in different growth stages are shown in the following figure:
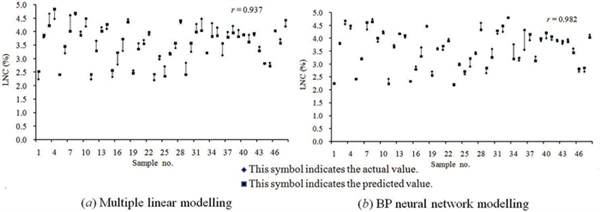
Figure 5-1 Jointing model verification results
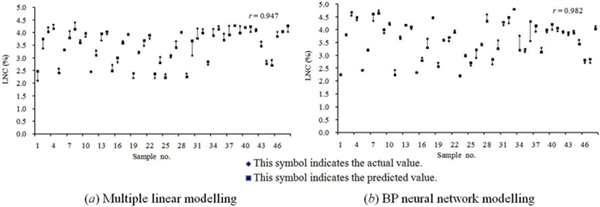
Figure 5-2 Flag verification period model verification result
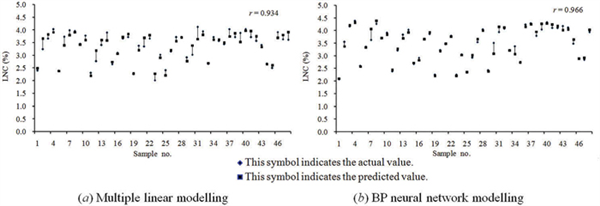
Figure 5-3 Flowering period model verification results
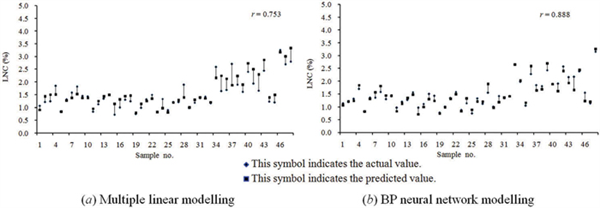
Figure 5-4 Model verification results during the filling period
5 Conclusion
The correlation between the hyperspectral data measured by the S185 airborne high-speed imager and the measured leaf nitrogen content is good. The reliability of the model is analyzed by model verification. The above method is a large-area airborne high-spectrum crop nitrogen. The analysis of the content of the element provides a certain reference.
Plastic Stand Illuminated Globe
Lighted World Globes,Lighted Globe On Stand,Vintage Illuminated Globe,Antique Light Up Globe
Ningbo Holly Arts & Crafts Co.,Ltd. , https://www.china-globes.com